BloodHound turns what you see on a chart into numbers it can combine. Every condition it evaluates, and its final result, is a confidence value from 0 to 1: 0 is unfavorable, 1 is fully favorable (0% to 100% confidence).
New to BloodHound?
Prefer to learn by doing? Build your first BloodHound system step by step first, then come back here for the ideas behind it. If you’d rather watch, the Getting Started videos go from installation to a backtested system.
Chart data → Solvers → Logic template → Result
At every step, on every bar (or tick), BloodHound keeps a separate value for the Long side and the Short side, so both are always evaluated at the same time but independently. Internally the Short value is positive; it is only drawn below zero (0 to -1) on the chart so the two sides are easy to tell apart.
BloodHound templates
Everything you build in BloodHound is saved in a BloodHound template (BHT), an XML file holding all your settings for a system. A BHT contains two kinds of component, and can hold as many of each as you like:
Solvers (in full, confidence solvers) evaluate conditions on the chart.
Logic templates combine the solvers’ results into a final output.
BHTs are saved in your NinjaTrader documents folder:
...\Documents\NinjaTrader 8\templates\BloodHound\Solvers
Every BloodHound calculation starts with the solvers. Each one looks at one aspect of the chart, such as price action, swing trends, support and resistance, an indicator’s value, two indicators compared, or an indicator’s slope, and grades it from 0 to 1 for each side. See the full list of solvers.
To look at several aspects of the chart, use several solvers. You can add as many as you like, but each one is more work for BloodHound, so it’s good practice to remove solvers that don’t contribute to the result.
Example
Your system says a rising indicator is good for longs and a falling one is good for shorts. Add a Slope solver for that indicator: it gives 1 on the Long side and 0 on the Short side while the slope is positive, and the reverse while it is negative. That is its default behavior. Then add solvers for the other parts of your system.
Logic templates
Logic templates are where BloodHound’s power and flexibility come from. A logic template works out the final result from the solvers, using a node diagram much like an electronic logic board. You connect solver nodes to logic nodes (AND, OR, XOR, Ratio, Additive and others), and chain outputs into inputs to build logic of any complexity.
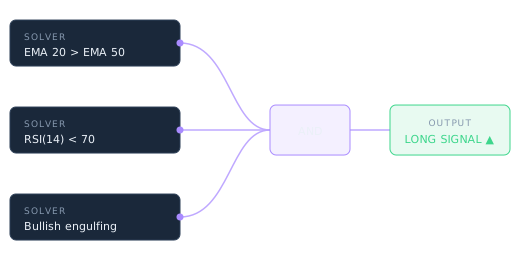
For example, one solver checks that an indicator’s slope is favorable, and another that price is far enough from support or resistance to take a trade. Your rules say both must be good, so connect both to an AND node: the result is only favorable when both solvers are. By default, “good” means 0.8 or higher.
A BHT can hold several logic templates. Usually one is active at a time (a NinjaTrader strategy can use several at once). The active template paints its signals on the chart as red and green “racing stripes”. You can switch the active template at any time from the drop-down at the top of the NinjaTrader chart.
Working on the Logic Board

Logic templates are built on the Logic tab. For a full tour of the window, see the BloodHound interface page.
Navigating the work area
Pan around the Logic Board by dragging with the middle mouse button (usually the wheel), or click the hand icon (Pan) to switch panning on and off. Zoom with the mouse wheel.
Working with nodes
If there’s no logic template yet, click New Logic. The Solvers, Function and Logic menus list the nodes you can add to the Logic Board.
Drag nodes to move them, or drag a box around several from an empty spot to select them together. Selecting a single node shows its settings in the Property Inspector on the right.
Connecting nodes
Each solver you have added is available as a solver node. A node’s output is the dot on its right; logic and function nodes also have an input on their left. To connect two nodes, drag from the output of one (usually a solver) to the input of the other (usually a logic node).
The Result node is always on the Logic Board. Connect your final output to it: whatever is connected to Result is what BloodHound plots on the chart.
Deleting nodes and connections
Hover over a connection and click the red ✖ that appears to delete it. To delete a node, click the red ✖ at its top right, or select it and press Delete.